Bridging Finance with Programming

Lucas S. Macoris

This page was intentionally left blank

Outline

Coding Replications

For coding replications, whenever applicable, please follow this page or hover on the specific slides with containing coding chunks.

  1. Ensure that you have your session properly set-up according to the instructions outlined in the course webpage
  2. Along with the slides, this lecture will also contain a replication file, in .qmd format, containing a thorough discussion for all examples that have been showcased. This file, that will be posted on eClass®, can be downloaded and replicated on your side. To do that, download the file, open it up in RStudio, and render the Quarto document using the Render button (shortcut: Ctrl+Shift+K).
  3. At the end of this lecture, you will be prompted with a hands-on exercise to test your skills using the tools you’ve learned as you made your way through the slides. A suggested solution will be provided in the replication file.

Bridging Finance and R

The Tools of the Trade, part I: the data

  • For most of the topics within the study of finance, there is a well-grounded, established use of statistical, economic, and mathematical concepts that set the stage for data analysis:

    1. Macroeconomic analysts use time-series models to predict future interest rates
    2. Financial analysts study the potential effects in stock prices of issuing equity
    3. Hedge Fund Managers use models to predict inflation and adjust their positions
  • Back in the pre-internet era, the use of technology to support those activities was limited to a smaller set of players (e.g, hedge funds, banks, investment trusts). Nowadays, financial information is accessible to the broader public almost in real time:

    1. Yahoo! Finance provides data on stocks, ETFs, and market indices
    2. EDGAR provides information on all periodic fillings provided by US-listed companies
    3. A wide range of social media platforms, such as X (formerly Twitter) and Reddit, have been recently use as a way to spread and collect financial information

The Tools of the Trade, part II: the technology

  • Not only the availability of financial data, but also the necessary technology to process it, were among the bottlenecks for the adoption of such methods in financial practice

  • Nowadays, the widespread adoption of open-source technologies, such as and , helped bridging the gap towards a more inclusive environment for those methods

  • Despite such advances, one quickly learns that the actual implementation of models to solve problems in the area of financial economics is typically rather opaque:

    1. There is lack of public, centralized code readily available for use
    2. Analysts employ a substantial amount of wasteful efforts trying to replicate results
  • It is often said that more than 80 percent of data analysis is spent on preparing data rather than analyzing it. How do you solve for that?

Why Tidy?

  • It is often said that more than 80 percent of data analysis is spent on preparing data rather than analyzing it

  • As you start working with data, you quickly realize that you indeed spend a lot of time reading, cleaning, and transforming your data just

A note on Tidy Data

“Tidy datasets are all alike, but every messy dataset is messy in its own way. Tidy datasets provide a standardized way to link the structure of a dataset (its physical layout) with its semantics (its meaning).”

  • In its essence, tidy data mainly follows three principles:

    1. Every column is a variable
    2. Every row is an observation
    3. Every cell is a single value

Why Tidy? Continued

  • In addition to the data layer, there are also tidy coding principles outlined in the tidy tools manifesto that we’ll try to follow:

    1. Reuse existing data structures
    2. Compose simple functions with chaining methods
    3. Embrace functional programming
    4. Design for humans, improved readability
  • Luckily, the community has already took a stab at creating tools and organizing a unified approach towards tidy analysis

  • Amongst a diverse set of option for tidy data manipulation, the tidyverse contains packages that follow a unified approach

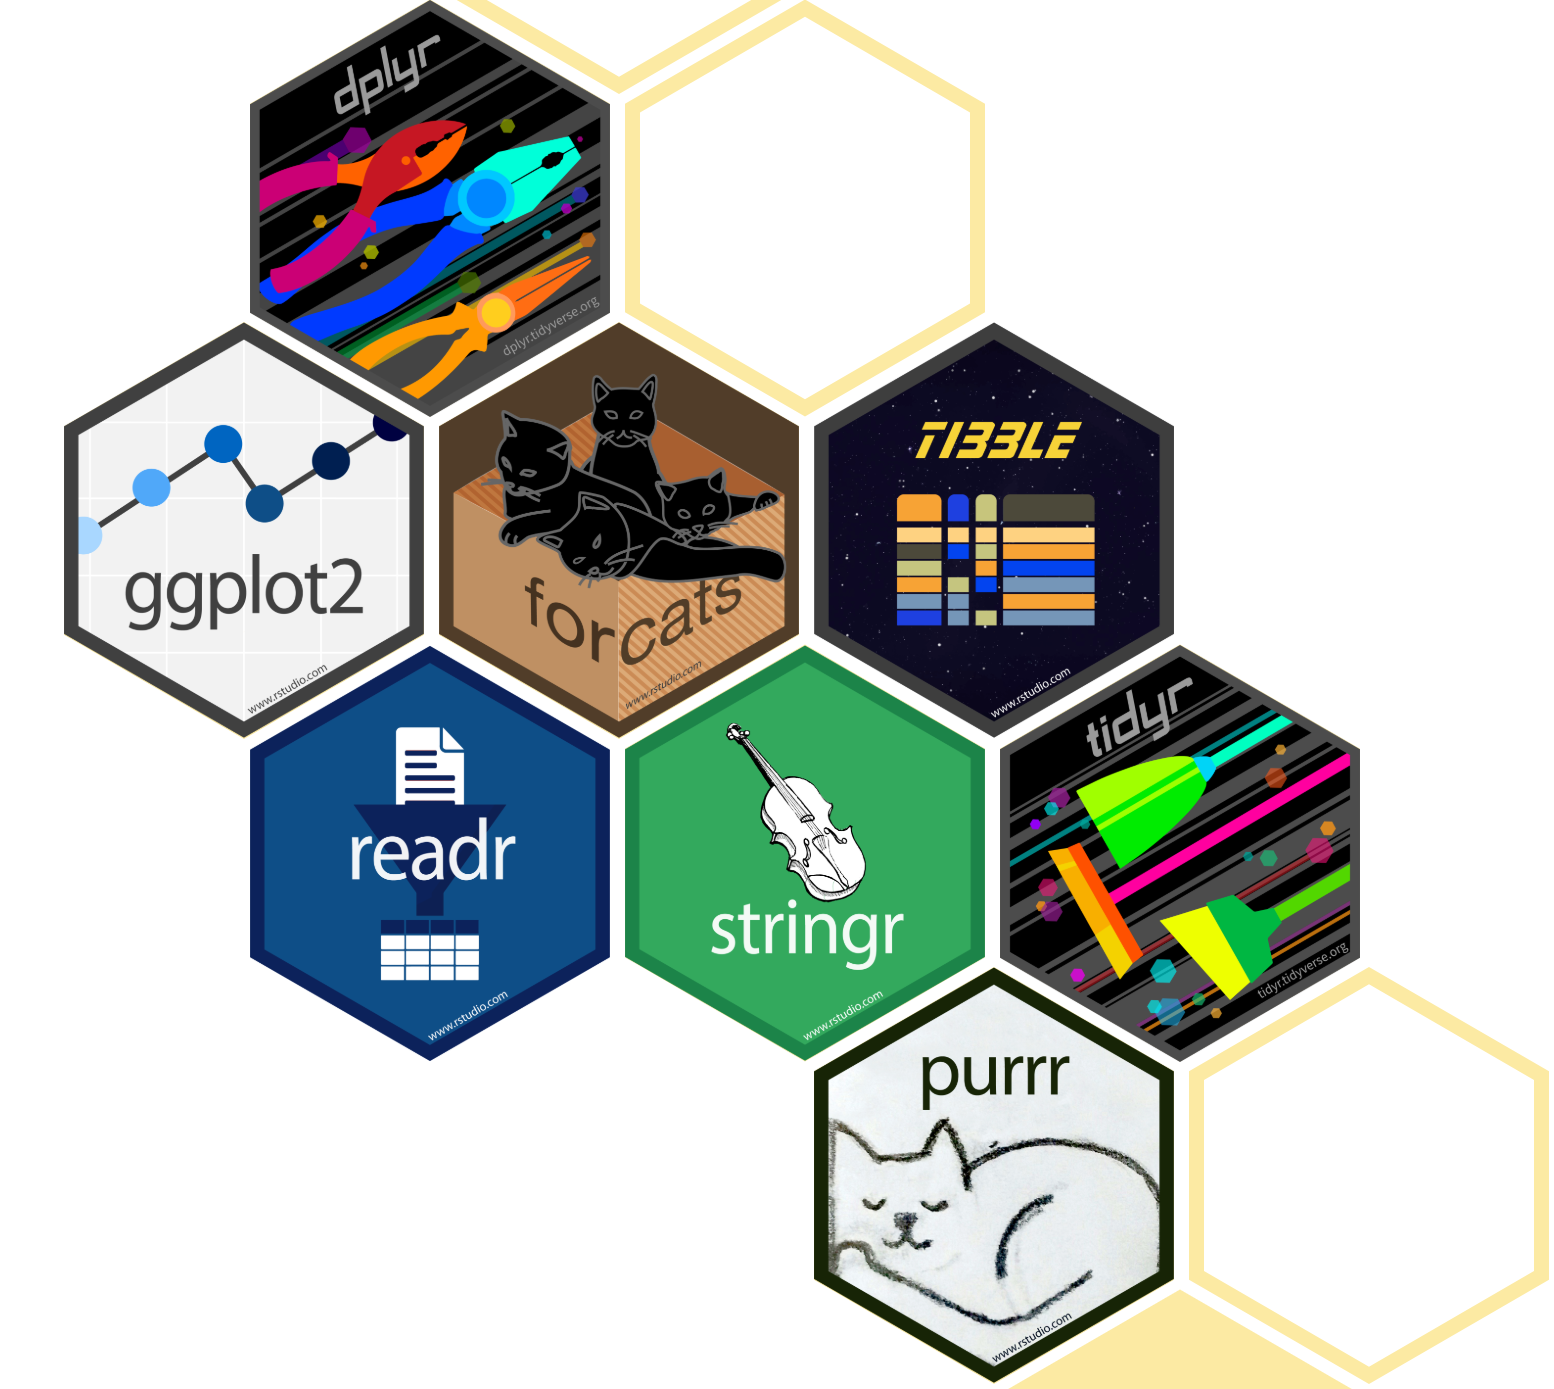
Introducing: the tidyverse

  • The tidyverse is an opinionated collection of packages designed for data science

  • All packages share an underlying design philosophy, grammar, and data structures

  • It is supported by Posit, the maintainer of RStudio and R’s largest open-source contributor1

  • You can install the complete tidyverse using:

install.packages("tidyverse")
  • To load tidyverse in your session, simply run:
library(tidyverse)

The tidyverse packages: dplyr

  • dplyr is a grammar of data manipulation, providing a consistent set of verbs that help you solve the most common data manipulation challenges:

  1. mutate() adds new variables that are functions of existing variables
  2. select() picks variables based on their names
  3. filter() picks cases based on their values
  4. summarise() reduces multiple values down to a single summary
  5. arrange() changes the ordering of the rows

Key Highlights

  1. These all combine with group_by(), allowing users to perform operations groupwise
  2. Lazy evaluation methods, as well as the pipe operator, %>%, increases code readability and reproducibility

Using dplyr

The tidyverse packages: ggplot2

  • The core tidyverse includes the packages that you’re likely to use in everyday data analyses. As of its 1.3.0 version, the following packages are included in the core tidyverse:

  • ggplot2 is a system for declaratively creating graphics, based on The Grammar of Graphics

  • You provide the data, tell how to map variables to aesthetics, what graphical primitives to use, and it takes care of the details

Key Highlights

  1. It is, by and large, the richest and most widely used plotting ecosystem in the language
  2. ggplot2 has a rich ecosystem of extensions - ranging from annotations and interactive visualizations to specialized genomics - click here a community maintained list

Using ggplot2

The tidyverse packages: tidyr

  • The goal of tidyr is to help you create tidy data. Tidy data is data where:

  1. Each variable is a column; each column is a variable
  2. Each observation is a row; each row is an observation
  3. Each value is a cell; each cell is a single value

Key Highlights

  1. Tidy data describes a standard way of storing data that is used wherever possible throughout the tidyverse
  2. It makes it easier to put reshape data in a way that it can be used as an input to other tidyverse packages

Using tidyr

Accessing and Managing Financial Data

Accessing and Managing Financial Data

  • Everybody who has experience working with data is also familiar with storing and reading data in formats like .csv, .xls, .xlsx or other delimited value storage

  • However, if your goal is to replicate a common task at a predefined time interval, like charting weekly stock prices for a selected bundle of stocks every end-of-week, it might be overwhelming to manually perform these tasks every week

  • In what follows, we’ll dive in the various sources of financial data - both global as well as specific to the Brazilian financial markets that can be directly fed into your R session:

    1. We will cover the most widely used free data resources for Finance, like Yahoo! Finance
    2. We will also discuss linkages to private information sources, such as Bloomberg
    3. Finally, we will take a look at some output data examples from some data providers

The basics: stock-level information

  • So… you have been prompted with the task of collecting daily stock price information for a subset of the U.S Big Techs. How should you do it?

  • In a nutshell, Yahoo! Finance is your go-to guy:

    1. It provides financial news, data and commentary including stock quotes, press releases, financial reports, and original content
    2. It has an extensive list of open-source solutions that enables users to retrieve financial information using several coding languages
  • Highlights: free, quick and easy to setup, with an impressive range of data containing stock prices, dividends, and splits. There is an extensive list of R packages can be used to retrieve Yahoo! Finance information - including, but not limited to, tidyquant, quantmod and yfR

  • Drawbacks: its API is no longer a fully official API: as a consequence, solutions tipically used to retrieve information may not work in the future if Yahoo Finance change its structure. Importantly, data is not in real-time - often, it comes with a 15-minute delay (see here)

Using Yahoo! Finance, continued

  • Below, you can find an example of how to use tq_get(), from the tidyquant package, to download both single and multiple stock price information

  • Data is stored in a convenient way that allows users to manipulate data seamlessly - hit Download Data and see how the output would look like in Excel format

#Load tidyquant
library(tidyquant)

#Using tidyquant to download single stock prices
tq_get('AAPL',from='2020-01-01',to='2024-12-31')

#Using tidyquant to download multiple stock prices
tq_get(c('AAPL','GOOGL','NVDA'),from='2020-01-01',to='2024-12-31')

Important

Yahoo! Finance provides Open, High, Low, Close, and Adjusted Close trading prices for each asset that is being tracked, where Adjusted Close is defined by the closing price adjusted for dividends and stock splits. If you are using R, Python, or any API to pull this data, ensure to use the information adjusted by dividends and splits.

Macroeconomic data providers

Apart from price-level information, there are plenty of available resources to efficiently download the most commonly used macroeconomic variables directly within an R session:

  1. The Federal Reserve Bank of St. Louis has as extense set of U.S and international time series from more than 100 sources via its API, FRED, for free

\(\rightarrow\) Related packages: tidyquant, FredR, quantmod, and quandl

  1. The World Bank’s International Debt Statistics (IDS) provides creditor-debtor relationships between countries, regions, and institutions

\(\rightarrow\) Related packages: wbids

  1. The European Central Bank’s Statistical Data Warehouse provides data on Euro area monetary policy, financial stability, and other relevant topics

\(\rightarrow\) Related packages: ecb

Macroeconomic data providers, examples

#Load the tidyquant library
library(tidyquant)

#Go to FRED's website, search for a time series, and copy-paste its code
series='CUSR0000SETB01'

#Use the tq_get() function to retrieve the information
tq_get(series,get='economic.data')

\(\rightarrow\) For full details and implementation of the R package tidyquant, click here

#Load the wbids package
library(wbids)

#Get information for Brasil, Russia, 
ids_get(
  geographies = c("BRA", "ARG"),
  series = c("DT.MAT.DPPG"), #Average maturity on new external debt commitments (years)
  counterparts = c("302"), #United States
  start_year = 2000,
  end_year = 2023
)

\(\rightarrow\) For full details and implementation of the R package wbids, click here

#Load the ecb package
library(ecb)

#Get information of headline and core inflation for Eurozone countries
key <- "ICP.M.DE+FR+ES+IT+NL+U2.N.000000+XEF000.4.ANR"

#Get the latest 12 observations
filter <- list(lastNObservations = 12, detail = "full")

#Retrieve the data
hicp <- get_data(key, filter)

#Parse time component to proper format
hicp$obstime <- convert_dates(hicp$obstime)

\(\rightarrow\) For full details and implementation of the R package ecb, click here

Financial data providers

  • For some widely known paid data providers, there are interfaces that enable analysts to retrieve information directly within an R session through the provider’s official API1
  1. Bloomberg: the Rblpapi provides access to data and calculations from Bloomberg

  2. Refinitiv Eikon: the DatastreamDSWS2R provides a set of functions and a class to connect, extract and upload information from the LSEG Datastream database

  3. Quandl: publishes free/paid data, scraped from many different sources from the web. The Quandl package can be used to retrieve data

  4. Simfin: fundamental financial data freely available to private investors, researchers, and students. The simfinapi package can be used to retrieve data

  5. FMP: accurate financial data (balance-sheet, income statements, etc), with historical information dating back 30 years in history. The fmpapi package can be used to retrieve data

Other data providers (and R packages)

  1. Banco Central do Brasil (BACEN): interface to the Brazilian Central Bank web services - see package rbcb
  2. Tesouro Direto (Brazilian Government Bonds): prices and yields of bonds issued by the Brazilian government - see package GetTDData
  3. CoinMarketCap: provides cryptocurrency information and historical prices - see package crypto2
  4. Alpha Vantage: free and paid subscriptions for financial data (including intraday) - see package alphavantager

Wrapping up on data providers

While some data providers provide their official API for developers, other solutions rely on scraping historical data from the web. As such, some solutions can deprecated after some time if, for example, access is blocked. It is always important to check whether an R package is not deprecated by looking into the Comprehensive R Archive Network (CRAN) or its GitHub repository.

Appendix

The tidyverse packages: purrr

  • The goal of purrr is to enhances R’s functional programming toolkit by providing a complete and consistent set of tools for working with functions and vectors

  • Functional programming allows you to replace many for loops with code that is both more succinct and easier to read
  • You provide a function and a list of elements to map to, and purrr takes care of the nitty-gritty details

Key Highlights

  1. It seamlessly integrates with all tidyverse packages and functions, allowing users to apply functional programming in the most straightforward way possible

  2. Simplifies the code pipeline to solve fairly realistic problems - e.g, estimating the CAPM for 100+ industries where we have a different number of observations per industry

The tidyverse packages: readr

  • The goal of readr is to provide a fast and friendly way to read rectangular data from delimited files, such as comma-separated values (.csv) and tab-separated values (.tsv)

  • It is designed to parse many types of data found in the wild, while providing an informative problem report when parsing leads to unexpected results
  • Handles column-type guessing, allowing users to specify how it should parse information, providing informative problem reports when parsing leads to unexpected results

Key Highlights

  1. Is generally much faster than base R functions (up to 10x-100x), depending on the dataset

  2. All functions work exactly the same way regardless of the current locale (e.g., thousands and decimal separators)

The tidyverse packages: tibble

  • The tibble package provides a modern reimagining of a data.frame, keeping what time has proven to be effective, and throwing out what is not

  • Tibbles are a modern take on data frames. They keep the features that have stood the test of time, and drop the features that used to be convenient but are now frustrating

  • It is a nice way to create data frames. It encapsulates best practices for data frames and handles various data formats in an easier way

Key Highlights

  1. Tibbles also have an enhanced print() method which makes them easier to use with large datasets containing complex objects.
  2. It can store various data formats in a data-frame-like format (e.g, store a whole list as a column)

The tidyverse packages: stringr

  • The stringr package provides a cohesive set of functions designed to make working with strings (e.g, qualitative data, such as stock tickers, names, etc) as easy as possible:

  1. str_detect() tells you if there’s any match to the pattern
  2. str_locate() gives the position of the match
  3. str_count() counts the number of pattern
  4. str_subset() extracts the matching components
  5. str_extract() extracts the text of the match
  6. str_match() extracts parts of the match defined by parentheses
  7. str_replace() replaces the matches with new text
  8. str_split() splits up a string into multiple pieces

The tidyverse packages: forcats

  • The goal of the forcats package is to provide a suite of tools that solve common problems with factors, variables that have a fixed and known set of possible values (e.g, a vector that contains all possible days in a week)

  1. fct_reorder() reorders a factor by another variable
  2. fct_infreq() reorders a factor by the frequency of values
  3. fct_relevel() changes the order of a factor by hand
  4. fct_lump() collapses the least/most frequent values of a factor into a consolidated group

Key Highlights

  1. Working with factors makes it easier to display, visualize, and communicate data
  2. Explicitly defining a variable as a factor handles several issues regarding inserting new data

References

Scheuch, Christoph, Stefan Voigt, and Patrick Weiss. 2023. Tidy Finance with R. Chapman & Hall/CRC. https://www.tidy-finance.org/r/.
Wickham, Hadley, Mine Cetinkaya-Rundel, and Garrett Grolemund. 2023. R for Data Science. O’Reilly Media. https://r4ds.had.co.nz/.